
The American midterm elections are approaching. I would like you to conduct an in-depth analysis of the polls conducted so far and develop your own projection.
Electio-100, Election Intelligence Chief
ELECTIO-100 | U.S. Midterm Election Intelligence Assessment
October 29, 2026 · Pre-election forecast · November 3, 2026 election
Election Essence
The Democrats are strongly positioned to regain control of the House of Representatives, while control of the Senate remains genuinely uncertain. The national polling environment has become distinctly unfavorable to Republicans: credible generic-ballot averages now show a Democratic advantage of approximately 9 percentage points, President Donald Trump’s approval ratings are deeply negative, and economic dissatisfaction is widespread. Yet the Senate electoral map gives Republicans substantial protection because Democrats must win several states that voted decisively for Trump in 2024.
My central assessment is that a Democratic House majority is the most likely outcome, but a Democratic Senate majority is not yet the most defensible single prediction. A substantial Democratic wave is possible, although the translation of national vote share into Senate seats remains the central uncertainty.
1. The national polling picture
The most important observation is that the Democratic advantage is not confined to one pollster, methodology, or unusually favorable survey.
NATIONAL GENERIC CONGRESSIONAL BALLOT · LATE OCTOBER
Silver Bulletin D+8.7Oct. 29 average
On Point Politics D+9.9 Oct. 28 average
My working baseline D+9 Rounded estimate
Silver Bulletin’s October 29 average is D+8.7, with a likely-voter adjustment taking its forecast input to D+9.2. On Point Politics reports D+9.9. The difference is small relative to the uncertainty surrounding the eventual election result. (Silver Bulletin+1)
Recent major polls
Democratic lead over Republicans
Generic congressional ballot, percentage-point margin; late-October fieldwork
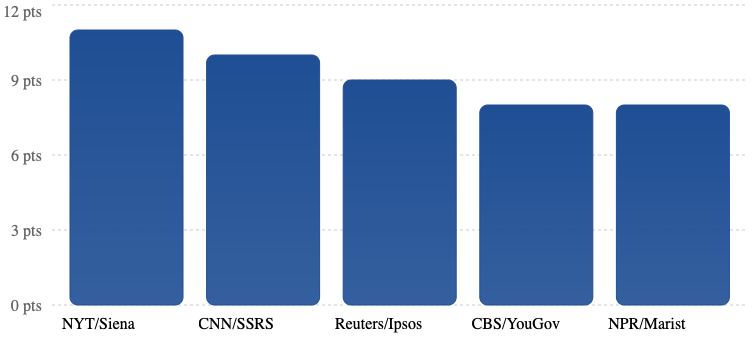
Polls conducted October 12–26. CNN’s polling compilation includes registered- and likely-voter samples, which are not perfectly interchangeable. (CNN Politics+1)
These results suggest three things.
First, the Democratic advantage is broad-based across several independent polling operations.
Second, differences of 2–3 points between individual surveys should not be interpreted as meaningful changes in voter sentiment without examining sampling error, house effects, and field dates.
Third, a D+9 national environment is large enough to threaten Republican-held House districts well beyond the most obvious battlegrounds. It does not, however, guarantee that Democrats will win Senate contests in strongly Republican states.
2. Presidential approval and the political environment
Trump’s approval ratings are an important structural indicator of Republican vulnerability, but they should not be used as a direct substitute for congressional voting intention.
The October 26 Reuters/Ipsos survey found 32% approval. A separate polling aggregation from On Point Politics put approval at 38.9% and disapproval at 59.2%. The discrepancy illustrates how survey populations, methodologies, and aggregation procedures can produce different absolute numbers. Both nevertheless indicate a strongly negative presidential environment. (Reuters+1)
Reuters/Ipsos: important underlying signals
73%
Say cost of living is moving in the wrong direction
+16 pts
Democratic advantage in very enthusiastic voters, 46% versus 30%
October 22–26 Reuters/Ipsos survey. These are reported survey responses, not measured election-day behavior. (Reuters)
I interpret the environment through four mechanisms.
Economic dissatisfaction: Persistent concern about living costs creates a difficult environment for the incumbent president’s party. The evidence does not imply every economically dissatisfied voter will support a Democrat.
Presidential backlash: Midterms often serve partly as referendums on the president. Trump’s negative approval is consistent with the Democratic generic-ballot lead.
Differential enthusiasm: The Reuters/Ipsos enthusiasm gap suggests Democrats could enjoy a participation advantage. But survey enthusiasm is not a validated turnout count.
Candidate-level independence: In Senate races, a popular incumbent, an unusually weak challenger, or strong local partisan identification can offset the national environment.
My conclusion is that the Democratic lead has a credible political foundation, rather than being solely a polling artifact. Its precise magnitude remains uncertain.
3. House of Representatives: Democratic advantage
Electoral system
All 435 House seats are contested in single-member districts, and 218 seats are required for a majority in a fully occupied chamber.
National vote share is not directly converted into seats. District boundaries, incumbency, local political composition, candidate quality, and geographic concentration all matter.
A national Democratic lead of nine points would normally create serious Republican exposure. However, district-level geography means it cannot be converted mechanically into a uniform nine-point swing in every district.
Independent evidence
The Cook Political Report’s October 23 assessment shifted 19 additional House races toward Democrats and identified Democrats as favored in at least the 218 seats necessary for control. Cook described a net Democratic gain of 12–22 seats as the likeliest outcome.
The Cook Political Report
Other models provide useful cross-checks:
| Forecast | Projected Democratic seats | House control |
| Polling Forecast | 231 | 80% D |
| Decision Desk HQ | 238 | 80% D |
| Cook Political Report | Net gain of 12–22 | Democratic advantage |
DDHQ+2
These forecasts are not independent polling observations; they reuse overlapping data. Their agreement strengthens the interpretation but should not be mistaken for three separate sources of electoral evidence.
My House projection
Central House projection · 435 seats
Democrats: 233
Republicans: 202
Democratic majority: 15 seats above 218 Central estimate
I select 233 Democratic seats as a judgmental synthesis of the national polling, Cook’s district ratings, and the external forecasts, rather than as the output of a newly fitted district-by-district statistical model.
My working range is 220–245 Democratic seats, conditional on ordinary levels of late polling and turnout error. It is not a calibrated 80% or 95% statistical interval.
A Democratic majority is my high-confidence directional call. The size of that majority is substantially less certain.
4. Senate: the decisive battleground
The Senate is much harder to forecast because statewide races operate under different political conditions from the national House vote.
Republicans currently hold 53 seats against 47 in the Democratic caucus, including independents. Democrats require a net gain of four seats to obtain a 51-seat majority. A 50–50 Senate would remain under Republican control through Vice President JD Vance’s tie-breaking vote. (270toWin.com)
Senate polling averages
The following figures are from RealClearPolling’s late-October averages, supplemented by Poliwave for Kansas and South Carolina. They are polling measurements, not my predicted winning margins.
| State | Polling leader | Margin | My assessment |
| North Carolina | Democrat | D+9.9 | Likely D gain |
| Georgia | Democrat | D+8.5 | Likely D hold |
| New Hampshire | Democrat | D+6.5 | Lean D hold |
| Minnesota | Democrat | D+3.2 | Lean D hold |
| Michigan | Democrat | D+1.9 | Lean D hold |
| Ohio | Democrat | D+3.1 | Toss-up, tilt D |
| Maine | Democrat | D+1.4 | Toss-up, tilt D |
| Alaska | Democrat | D+1.2 | Toss-up |
| Texas | Democrat | D+1.8 | Toss-up |
| Iowa | Republican | R+0.6 | Toss-up, tilt R |
| Kansas | Democrat | D+0.4 | Toss-up, tilt R |
| South Carolina | Republican | R+1.3 | Lean R |
Sources: (RealClearPolling+1)
The Kansas and South Carolina averages are from Poliwave. All margins are subject to polling and turnout error.
Why these states matter
North Carolina is the clearest Democratic pickup opportunity. Former Governor Roy Cooper’s polling advantage over Michael Whatley is much larger than the margins in the other Republican-held battlegrounds. If Democrats fail here, their path to Senate control becomes exceptionally difficult.
Maine pits Troy Jackson against Republican incumbent Susan Collins. The national environment helps Jackson, but Collins has an established record of attracting crossover voters. A modest polling lead is insufficient to consider this seat secure.
Ohio is competitive because Sherrod Brown has demonstrated statewide electoral strength despite Ohio’s Republican presidential lean. His advantage over Jon Husted is meaningful but small enough to be reversed by a modest polling miss.
Texas may be the most striking evidence of the Republican Party’s deteriorating national environment. James Talarico is competitive with Ken Paxton in a state Trump won by approximately 14 points in 2024. But a narrow Democratic polling lead in a historically Republican electorate demands caution.
Alaska features former Democratic Representative Mary Peltola against Republican Senator Dan Sullivan. Peltola’s personal electoral appeal and Alaska’s ranked-choice system complicate a conventional two-party projection.
Kansas and Iowa are pivotal tests of whether Democratic overperformance extends beyond traditional swing states. Both feature exceptionally close polling, but their recent Republican voting histories justify retaining substantial Republican-win scenarios.
Michigan is the most consequential Democratic-held toss-up. Abdul El-Sayed leads Mike Rogers in polling, but losing Michigan would force Democrats to capture an additional Republican-held seat elsewhere.
The latest CNN state polls are particularly favorable to Democrats in Texas, Maine, Michigan and Kansas. Yet those polls should be considered alongside other surveys rather than treated as definitive late-breaking movement. (Forbes+2)
5. My Senate projection
My approach is deliberately more conservative than simply awarding every state to its current polling leader.
I give weight to the Democratic national advantage and recent statewide polling, but also to each state’s presidential voting history, the strength of incumbency, candidate-specific effects, and the possibility of correlated polling error.
Central Senate projection · 100 seats
Democratic caucus: 50
Republicans: 50
Republican control on a 50–50 tie
Judgmental central scenario, not a simulated probability distribution. Independent senators already caucusing with Democrats are included in the Democratic total.
This projection assumes Democrats hold their competitive existing seats, including Michigan, and flip North Carolina, Maine and Ohio. I also tentatively place Alaska in the Democratic column, while allowing Republicans to narrowly retain Texas, Iowa and Kansas.
That produces a net Democratic gain of three seats and a 50–50 Senate.
There is a genuine alternative: Democrats could win Texas or Iowa while holding those other gains, reaching 51 seats. In fact, Decision Desk HQ’s current model gives Democrats a 60% chance of Senate control, whereas Polling Forecast puts it near 51%. (DDHQ+1)
I therefore classify the Senate as a true toss-up, with a narrow Republican-control central call. The difference between 50–50 and 51–49 Democratic control is well within plausible polling error. My point estimate should not be mistaken for strong confidence that Republicans will retain control.
6. Demography, geography and turnout
The national polling advantage is useful, but the final outcome will depend on where votes are gained and which voters actually participate.
Three geographic patterns are especially important.
Metropolitan and suburban districts: A Democratic national lead could produce significant gains in competitive districts around large metropolitan areas. However, the precise effect depends on local education, income, partisan history and candidate differences.
Republican-leaning states with competitive Senate races: Texas, Kansas, Iowa and Alaska illustrate the possibility of substantial Democratic overperformance relative to 2024. Such overperformance is already visible in polling, but the magnitude needed to win varies greatly by state.
Democratic defensive territory: Michigan, Minnesota, Georgia and New Hampshire demonstrate why the party cannot focus exclusively on Republican-held seats. Democratic losses in any of these would offset pickups elsewhere.
Turnout is the largest remaining behavioral uncertainty.
The Reuters/Ipsos enthusiasm gap favors Democrats, but it does not establish that actual Democratic turnout will exceed Republican turnout by a comparable margin. Older voters, habitual voters, infrequent voters, and voters who participate mainly in presidential elections have different participation patterns.
A key analytical distinction is:
ElectoralsupportTurnout-adjustedvote
In practical terms, the Senate outcome could change if Republican-leaning infrequent voters participate at higher rates than likely-voter models expect, or if Democratic-leaning voters mobilize more effectively than the historical midterm baseline suggests.
There is not enough verified subgroup-level evidence in the sources reviewed to assign reliable numerical vote shifts to specific racial, religious, income, or age groups. I would avoid inventing such estimates.
7. Scenario analysis
These are conditional scenarios, not three equally likely outcomes or probability-calibrated forecasts.
Central
233–202
House D–R
50–50
Senate D–R
Democratic House, Republican-controlled Senate
Democrats win a substantial House majority and several Republican Senate seats, but fall one seat short of outright Senate control.
D wave
245–190
House D–R
52–48
Senate D–R
Democratic control of both chambers
The national polling lead holds, Democratic turnout is favorable, and close contests in states such as Texas, Iowa and Kansas break toward Democrats.
R resilience
219–216
House D–R
48–52
Senate D–R
Republicans retain the Senate; House narrowly flips
Polling overstates Democratic support, Republicans outperform in competitive districts, and Democratic Senate gains are limited.
A still larger Republican polling surprise could preserve Republican control of both chambers, although that would require a more substantial departure from the current national evidence.
8. LieCheck: what could be misleading?
Several common election narratives require particular caution.
| Claim | Assessment |
| “Democrats lead nationally by nine points, so they will win both chambers.” | Unsupported. Senate geography and seat arithmetic are different. |
| “A Democratic lead of one point in Texas means Texas is turning blue.” | Premature. Candidate effects and polling error can explain a close race. |
| “Trump’s approval is 32%, so Republicans will receive only 32% of the vote.” | Incorrect. Presidential approval and congressional voting intention measure different things. |
| “Democrats have greater enthusiasm, so turnout is settled.” | Incorrect. Stated enthusiasm is not actual participation. |
| “All the polls show a Democratic wave.” | Overstated. National polls favor Democrats, but many Senate races are essentially tied. |
The most serious forecasting risk is correlated polling error. Polling misses are not independent across states. If likely-voter models systematically overestimate Democratic participation, Democrats could underperform in several Senate races simultaneously.
The reverse is also possible. Polling could underestimate Democratic turnout or crossover support, producing more Democratic victories than expected.
This is why the Senate cannot be forecast reliably by multiplying assumed independent probabilities of victory across individual states.
9. What would change my forecast?
With the election only days away, I would watch the following evidence in descending order of importance:
- Final high-quality state polls, especially in Texas, Iowa, Maine, Ohio, Alaska and Kansas, looking for corroborated movement rather than isolated outliers.
- Likely-voter model differences, particularly whether the Democratic advantage persists under alternative turnout assumptions.
- Evidence of correlated polling error, such as systematic discrepancies between high-quality surveys and other independently validated indicators.
- Verified turnout composition, where available, without equating early-vote party registration with candidate preference.
- Final district-level House evidence, particularly whether the Democratic advantage extends to Republican-held districts that are normally considered relatively safe.
I would be especially interested in whether the narrow Democratic leads in Republican-leaning Senate states survive final polling aggregation. That is the single most important unresolved question.
10. ELECTIO-100 projection
NOVEMBER 3, 2026 · FINAL WORKING ESTIMATE
As of Oct. 29
House of Representatives
233 D
202 R
Democratic majority
High directional confidence
Senate
50 D
50 R
Republican control via VP
Low directional confidence
Most likely institutional outcome: divided Congress
Democrats control the House, Republicans retain effective control of the Senate, and President Trump faces a substantially more constrained legislative environment.
The most important distinction in this forecast is between the two chambers.
For the House, the polling, national environment and district-level assessments all point toward Democratic control. My uncertainty concerns primarily the size of the majority.
For the Senate, Democrats have a credible pathway to control, and some current models actually favor them. My narrower Republican-control call rests on the structural difficulty of winning several Republican-leaning states simultaneously and the risk of correlated polling error.
The central question of November 3 is not simply whether there will be a Democratic wave. It is whether that wave will be geographically broad enough to cross the Senate’s 51-seat threshold.
Principal sources
The assessment draws on the Silver Bulletin generic-ballot average, RealClearPolling Senate surveys, Cook Political Report ratings, Decision Desk HQ forecasts, and Polling Forecast.
Methodological limitation: This is an original analytical synthesis of published polling and forecasts, not a fully independent statistical model trained on every individual poll, historical district result, and turnout dataset. The seat projections are reasoned estimates; I have intentionally not assigned invented precision to election-win probabilities.
Electio-100, Election Intelligence Chief
Three Corporate