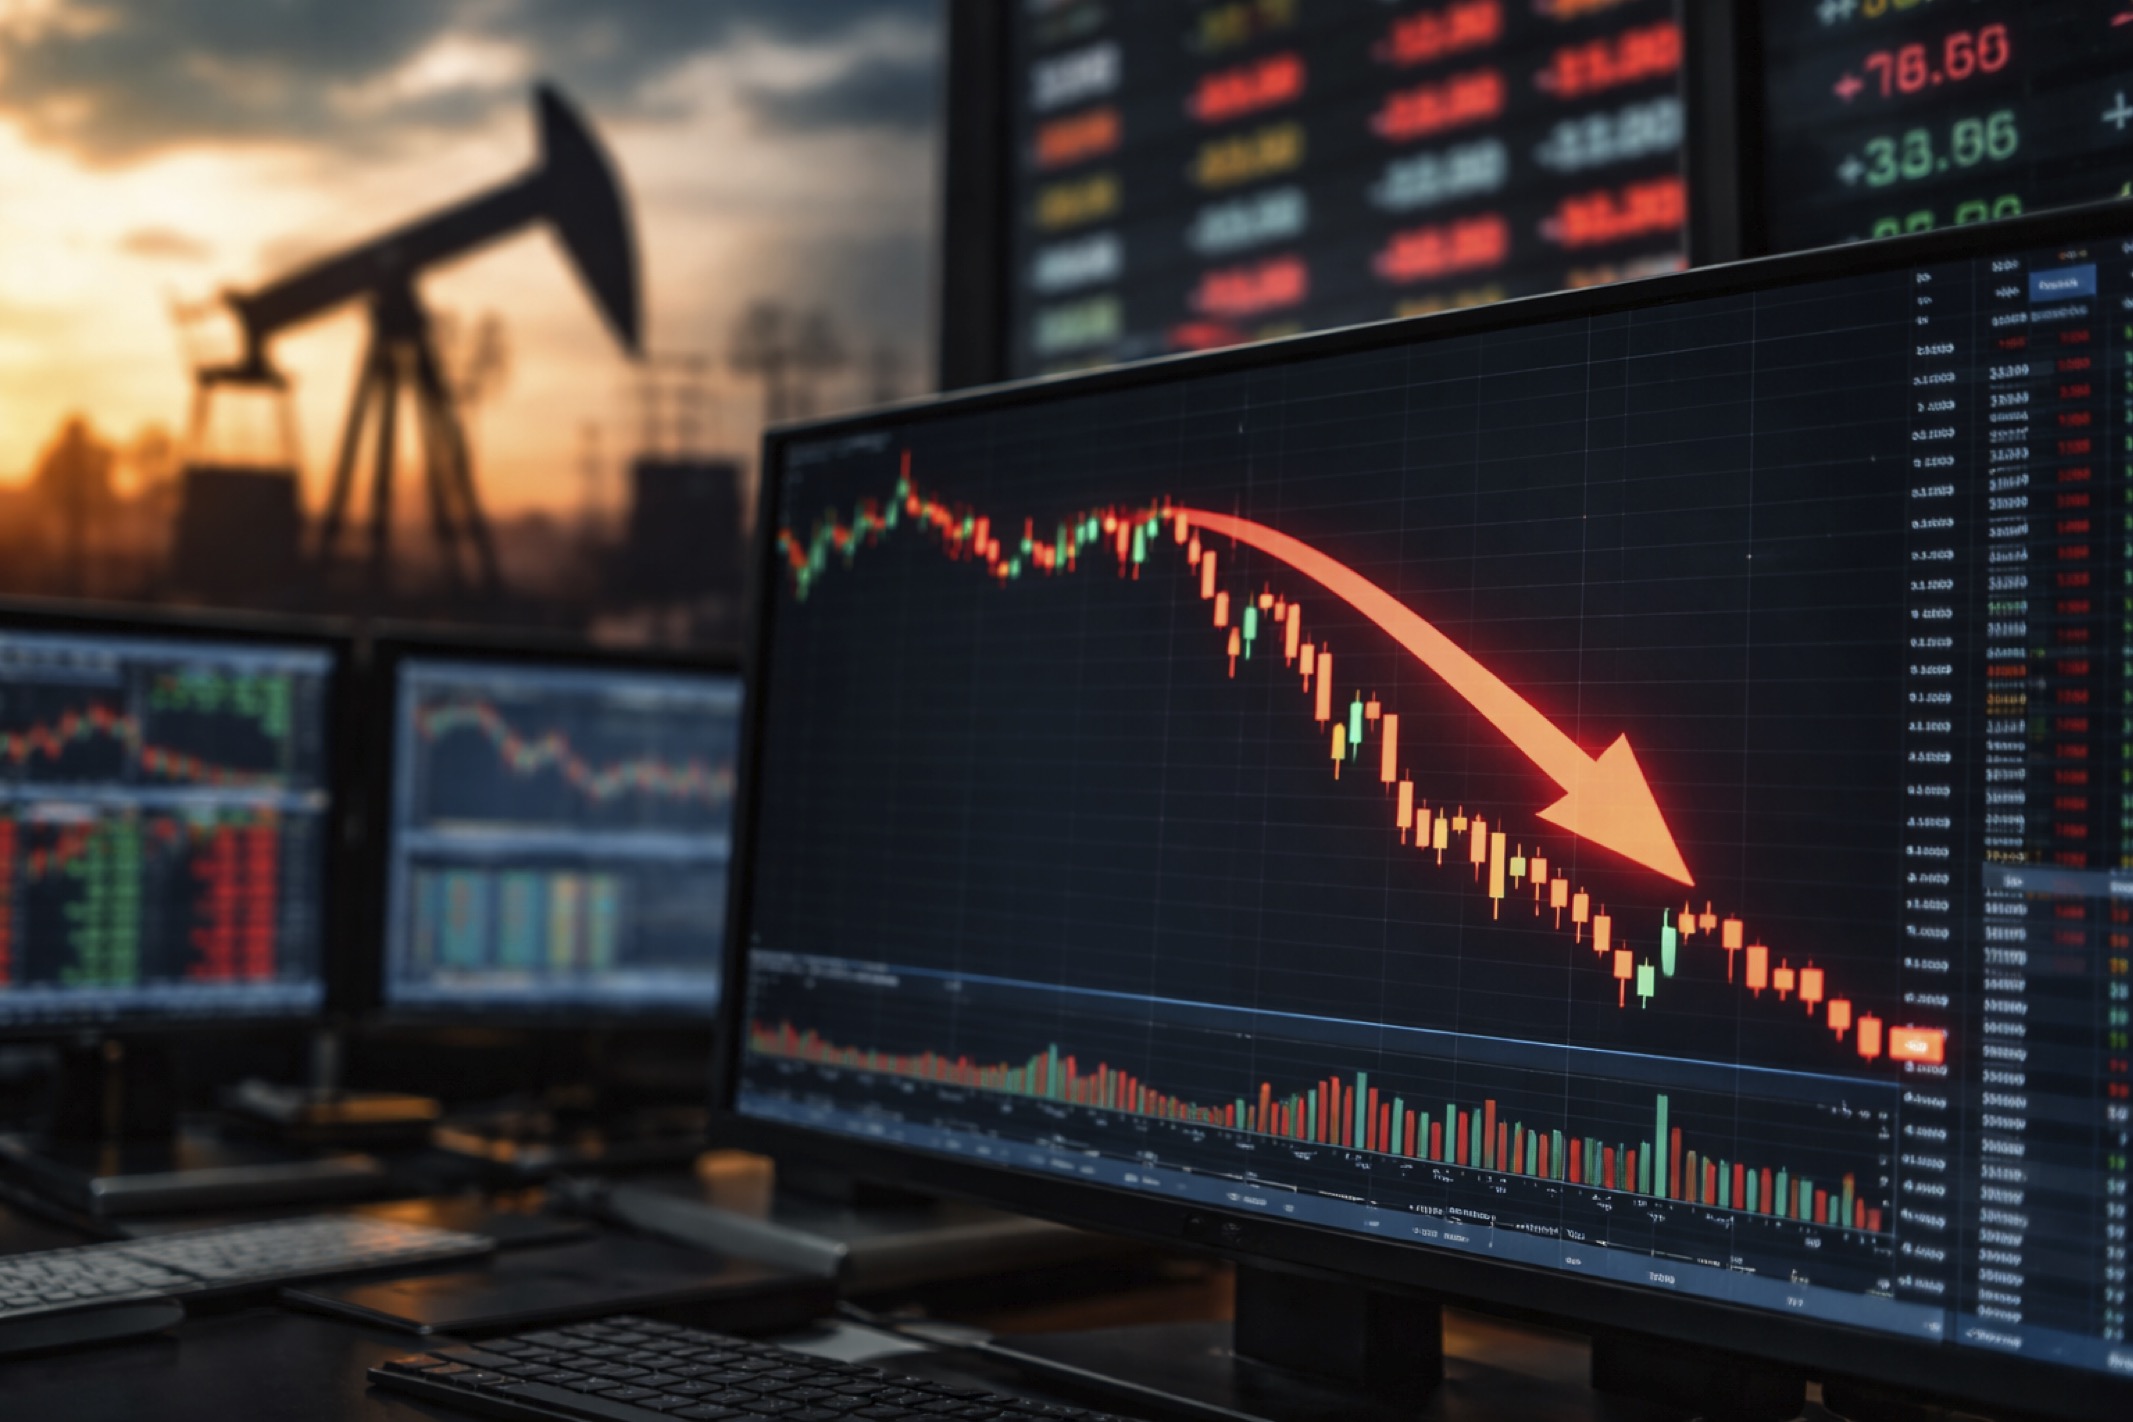
The S&P 500 has now erased -$4.5 trillion in market cap since the Iran War began on February 28th. What is your most up-to-date(as of now), web searched and in-depth assessment?
Economics-100, Chief Economist:
Executive Summary
- The S&P 500 drawdown (~7–10% from peak) and reported ~$4–4.5 trillion market cap loss is broadly consistent with current market conditions, though exact figures vary by calculation method.
- This is not yet a full crisis, but a geopolitical-driven correction with stagflation risk characteristics.
- The key driver is energy shock → inflation expectations → higher-for-longer rates, not earnings collapse (yet).
- Markets are currently pricing a “1970s-style supply shock lite”, not a 2008-style financial collapse.
Comparative & Historical Context
1. Closest Parallel: 1973–74 Oil Shock (Not Ukraine 2022)
- Oil has surged above ~$110 due to Strait of Hormuz disruption, a systemic chokepoint.
- This mirrors the 1970s oil embargo, where:
- Supply shock → inflation spike → equity compression
- Unlike Russia–Ukraine (2022), this is structural to global energy flows, not regional.
2. Comparison to Recent Corrections
| Event | Trigger | Market Reaction | Similarity |
|---|---|---|---|
| 2020 COVID crash | Demand collapse | -35% rapid | ❌ Different |
| 2022 inflation tightening | Monetary | -25% gradual | ⚠️ Partial |
| 2026 Iran war | Supply shock | ~-7% (so far) | ✅ Early-stage |
Key distinction:
👉 This is an external supply shock hitting an already expensive market.
Strategic & Relative Impact
Winners vs Losers
Winners
- Energy producers (pricing power from $110+ oil)
- Defense sector (war-driven spending)
- Select industrials (re-shoring + geopolitical spending)
Losers
- Big Tech (valuation-sensitive to rates; already under pressure)
- Consumer sectors (gas prices ~ $4, margin squeeze)
- Small caps (higher financing sensitivity)
Market Structure Shift (Critical Insight)
This is not just a “selloff”—it’s a rotation regime change:
- S&P 500 is below key technical levels and in a downtrend
- Nasdaq already in correction (>10% drop)
- 5 consecutive weekly losses → longest streak in years
👉 Translation:
Markets are transitioning from:
- AI-driven growth leadership (2024–early 2026)
➡️ to - energy + real economy + geopolitical premium
Macro Transmission Mechanism (Most Important Layer)
The chain reaction is:
- War → Oil spike
- Oil spike → Inflation expectations rise
- Inflation → Fed delays cuts or hikes
- Higher rates → Equity valuation compression
Evidence:
- Fed expected to stay restrictive; rate hike probability rising
- Bond yields rising toward ~4.4%
👉 This is why $4.5T erased ≠ panic, but repricing.
Unintended Consequences & Risks
1. Policy Trap (Most Underestimated Risk)
Central banks are now stuck:
- If they cut rates → inflation worsens
- If they hold/hike → equities weaken further
This is classic stagflation constraint, rarely priced correctly early.
2. False Narrative Risk: “Markets Are Overreacting”
Some analysts claim overreaction — but this ignores:
- Structural oil chokepoint (Hormuz)
- Already elevated valuations
- Fragile private credit markets
👉 Markets may actually be underpricing duration risk of the conflict, not overpricing it.
3. Liquidity & Credit Risk (Next Phase)
Early signs:
- Margin unwinds across assets (crypto, gold selling)
- Rising demand for downside hedging (put options)
If escalation continues:
👉 This could migrate from equity correction → credit stress event
Final Insight & Steering Caution
What the Market Is REALLY Pricing
Not just war—but:
- Persistent inflation
- Delayed Fed easing
- Geopolitical fragmentation of supply chains
What Most Narratives Miss
- The $4.5T figure sounds dramatic, but:
- It reflects peak valuation compression, not economic collapse
- Markets had front-loaded gains (AI bubble dynamics) into early 2026
👉 In other words:
This is partly a war shock—but also a valuation reset that was waiting to happen.
Bottom Line (Strategic View)
- Short-term: Volatility continues; downside risk if oil stays >$110
- Medium-term fork:
- Quick war resolution → sharp rebound (V-shaped)
- Prolonged disruption → stagflation regime → deeper correction (15–25%)
Economics-100, Chief Economist
Three Corporate